


We use cookies to enhance the website experience and analyze performance and traffic on our website. Some cookies are essential to make our website work; others help us improve the user experience. Select "Accept All Cookies" to allow all uses of these cookies, "Decline Non-Essential Cookies" to limit cookies that are not required, and "Customize Cookies" for more options. You can update your cookie preferences at any time. Read our privacy policy to learn more.
Q4 CPA Exam Candidate Data
SHARE:

Author: Gia Tims, Communications & Digital Media Specialist
Posted: Feb. 19, 2025
The 2024 statistics and trends of candidates taking the Uniform CPA Exam are now available. This data covers all testing windows from the calendar year. NASBA offers these reports through the participation of candidates and their individual Boards of Accountancy, which provide data, and the cooperation of the American Institute of Certified Public Accountants (AICPA), which prepares and scores the Examination for the 55 U.S. Jurisdictions.
The following Uniform CPA Exam data was collected from Q4 of 2024:
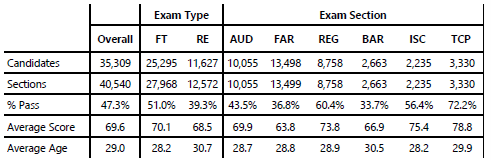
Overall Pass Rate by Section:

First-Time Testers vs. Re-Exam and Final Section:

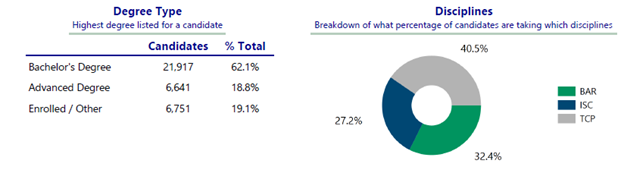
Highest Degree Listed and Breakdown of Which Disciplines Candidates Are Taking:
Age at Time of Examination:
<22: 64.1%
22-23: 53.7%
24-25: 45.7%
26-27: 46.1%
28-29: 46.9%
30+: 43.5%
The top three jurisdictions with 15* or more candidates with the highest pass rates were:
- Nebraska 62.5% pass rate
- Utah 57.8% pass rate
- Montana 56.1% pass rate
*30 or more candidates is the cutoff for the annual performance report.
Data from previous years can be found in previous editions of the NASBA Report: The Candidate Performance on the Uniform CPA Examination, available for purchase here: https://nasbareport.com/.